Box Following Robot
Making a robot move towards a red box through the use of Machine Learning
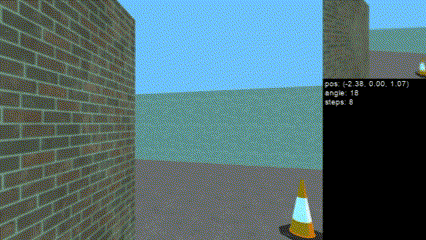
This project was a final assignment for the Machine Learning course in my Robotics Master. The whole aim was to make the robot succsefully reach the red cube by training a certain Machine Learning model on given training data. As it can be seen below the robot does that succsefully.
For this project several steps were done.
- Feature Extraction
- Model Comparison
- Fine-Tuning model
- Model Evaluation
Feature Extraction
We decided to represent the position of the red box as the column and row of the center pixel of the red box. To calculate this for each image, a range of red, green, and blue values were found that isolates the red box from the rest of the image. Once all the pixels are found that adhere to the color mask (i.e. that belong to the red box), the mean row and column is determined out of this the set of red pixels and is rounded off to represent the center row and column of the red box.
The following three points illustrate the primary reasons for performing dimensionality reduction on the feature space:
- High-dimensional data is hard to visualize
- High-dimensional data results in a greater risk of overfitting
- High-dimensional data requires a lot of computational resources and results in a high runtimes
Hard to visualize: Data of more than 3 dimensions is often hard to visualize, which can make it hard to analyze higher-dimensional data to for instance find patterns in the data or to identify overfitting. However, since our feature space is only 2-dimensional, visualizing the data is not a problem.
Risk of overfitting: The greater the dimensionality of the data, the farther the training instances become separated from each other, which makes the dataset more sparse and increases the risk of overfitting. However, our feature space is only 2-dimensional and as can be seen in the figure above, most instances are quite close together. Hence, dimensionality reduction does not seem to be necessary to reduce overfitting.
Computational resources: Training a model using training data which contains a lot of features can take an incredibly long time. However, since we only have 2 features, training the models should not take very long.
Fine-Tuning Model
In this case the hyperparameters were fine tuned. This was done through 2 methods: Random Search Cross Validation and Grid Search Cross Validation.
Below, you find the ranges that were assigned to each hyperparameter in the Random Search CV.
    'n_estimators': np.arange(10, 1000, 20),
    'max_depth': np.arange(1, 50),
    'min_samples_split': np.arange(2, 20),
    'min_samples_leaf': np.arange(1, 20),
    'class_weight': [{0: 1, 1: 1, 2: i/10000} for i in np.arange(1, 10000, 50)]
Performing Grid Search CV on these parameter resulted in the following optimal hyperparameters:
    max_depth = 7,
    min_samples_leaf = 1,
    min_samples_split = 4,
    n_estimators = 925,
    class_weight = {0: 1, 1: 1, 2: 0.64}
